We are working to show data from a variety of inputs and outputs at a given facility. Each facility can have any number of inputs and any number of outputs.
For example:
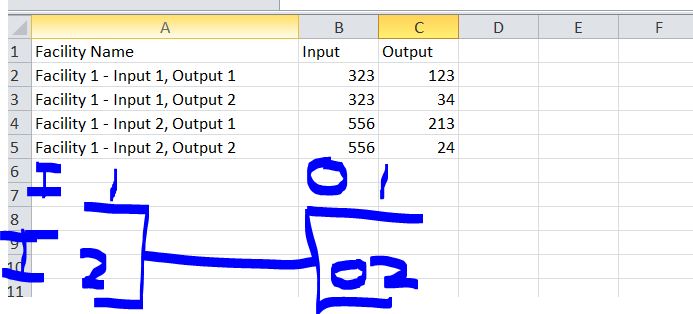
Facility 1 takes in the values 323 and 556. It outputs the values 123, 34, 213 and 24. Our current implementation shows that facility four (4) times because every combination of variables must be shown:

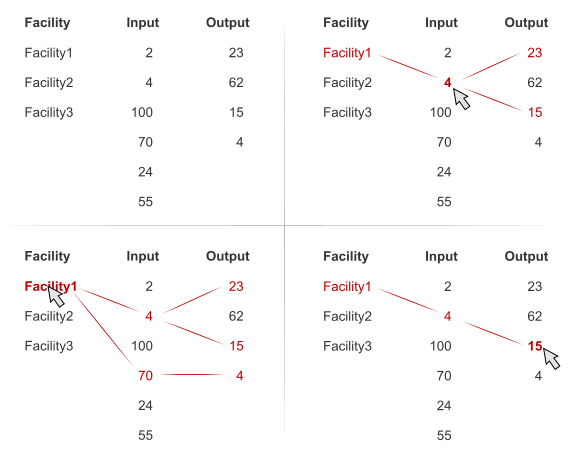
I am trying to figure out if there is a more user-friendly way to display the data. We are NOT using Excel (just used it for demonstration purposes, can't show the program), but we can execute any arbitrary code and change the layout of our internal program any way we like.
- The relationship between the input and output is what is being looked at
- Range of in and out varies from 0 to 10,000; number also varies but should not be more than 20.
- There is not a 1:1 mapping between inputs and outputs. Some places may have 3 inputs and 2 outputs or 1 input and 5 outputs, etc.
- Grid will be live updating
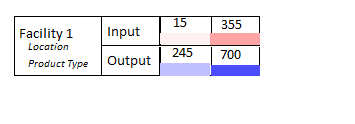
- The goal is to read the values on the right, have the text on the left give the numbers meaning/context, and for the reader to make some decisions based on that
Each input and output has different critical points. Sometimes the input may be too low, the output may be to high, or vice versa. Manipulating the input affects the corresponding out put but the high and low points vary on a day to day basis and on a per facility basis. This knowledge is all contained in the head of the person using the program, it is not a point that can be referenced.


