100

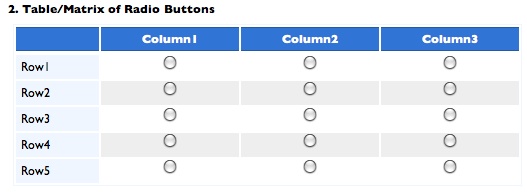
Is there any research out there showing whether or not alternating the row colors for a table increases/impedes the time it takes to parse information? An example can be found at the following location:

enter image description here

I generally find it easy to associate the input fields with the row names as long as the table is formatted correctly. So, I am not sure if alternating the colors actually adds to the user experience, but I guess I can see why this is stylistically appealing.

3
  • I'm not going to be citing any scientific survey or anything like that, so I'll make this a comment instead of an answer, but I prefer zebra'd tables. The color difference should be slight, however -- I don't like strong zebras. Also, as explained by others, the very best method is allowing the user to highlight a selected row, but that's sometimes not really appropriate, in which case a weak zebra is preferred.
    – Michael
    Commented Feb 17, 2011 at 9:25
  • 19
    The example is bad because the first column is not included in the alternate coloring, making it rather painfully useless.
    – ammoQ
    Commented Feb 17, 2011 at 14:59
  • 1
    Zebra strips add noise without meaning to tables. Please avoid them. Edward Tufte (top visualization expert) says so, and me too :). "Strips are merely bureaucratic or designer chartjunk; good typography can always organize a table, no stripes needed". Longer explanation here: ux.stackexchange.com/a/121430/33122 Commented Oct 10, 2018 at 1:05

8 Answers 8

75

Jessica Enders wrote an article on A List Apart about three studies she did to determine whether "zebra stripes" are helpful.

The first study, described in an earlier article, tested users' ability to read and interpret data in a simple table. The second study was similar to the first, with an improved methodology. The third study attempted to determine whether users tend to have a subjective preference for striped tables.

The recommendation

The results of the three studies conducted to date suggest that the safest option is to shade the alternating, individual rows of your table with a single color. Taking this approach is likely to ensure that:

  • task performance is better, or at least no worse, than with other table styles, and
  • the aesthetic sensibilities and subjective preferences of the majority of your users are catered for.

If zebra striping of this type cannot be done easily, then ruling a line between each row may be the next best option.

Update: Don't miss Filipe Hoffa's answer below.
9
  • 3
    Funny, I just read a study that said exactly the opposite. I'm going to see if I can dig it up. Commented Feb 16, 2011 at 18:47
  • 8
    I believe this is the follow up article
    – sholsinger
    Commented Feb 16, 2011 at 21:48
  • 1
    This experiment shouldn't be used as a general guide since it lacks different scenarios (small datasets, big datasets, small gaps between columns/rows, big gaps etc). My gut feeling is that zebra stripes help, but on the other hand - why doesn't Excel use zebra stripes in its standard mode (you have to create a table with custom striping)? Commented Feb 17, 2011 at 9:25
  • 1
    @Pat and by that you mean it completely reverses your original answer :p Commented Feb 18, 2011 at 2:56
  • 1
    @HenrikEkblom: "why doesn't Excel use zebra stripes in its standard mode (you have to create a table with custom striping)?" - I suspect for purely technical reasons: Unless explicitly specified otherwise, each cell uses the default background colour. Automatically initializing every second row across the entire sheet with a different background colour setting (or assigning a conditional formatting to all cells) would not simply be a different preset, but rather an entirely new feature. Combine that with the issue that there are many cases where the default would not work (a focus on ... Commented Jun 22, 2017 at 10:51
28

For on-screen tables, I think it's best to have non-alternating tables but have the entire row under the mouse to be highlighted. Also, the column header that the mouse is pointing should also be highlighted.

3
  • 20
    That would work for everyone that uses a mouse Commented Feb 16, 2011 at 17:35
  • 2
    As an alternative, you could make clicking/tapping the row highlight it too.
    – MJeffryes
    Commented Feb 16, 2011 at 21:17
  • 2
    @Joe Philllips: The idea is that since a screen can change the highlighted row/column does not need to be static. The primary idea is that we can infer which row/column that the user is currently interested at by observing user's behavior; the input for highlighting does not have to be a mouse, it can be eye tracking, or last clicked/tapped row/column (for touchscreen), or the arrow key in keyboard (for users that doesn't have or cannot use mouse or prefers keyboard navigation). The basic idea is that we can and should take advantage of the fact that computer screen is dynamic.
    – Lie Ryan
    Commented Feb 17, 2011 at 14:11
25

Don't. Don't use zebra stripes.

Let me quote Edward Tufte:

Again, this is a solved problem, with examples in Envisioning Information, chapter 3. Strips are merely bureaucratic or designer chartjunk; good typography can always organize a table, no stripes needed.

-- Edward Tufte https://www.edwardtufte.com/bboard/q-and-a-fetch-msg?msg_id=0001IV

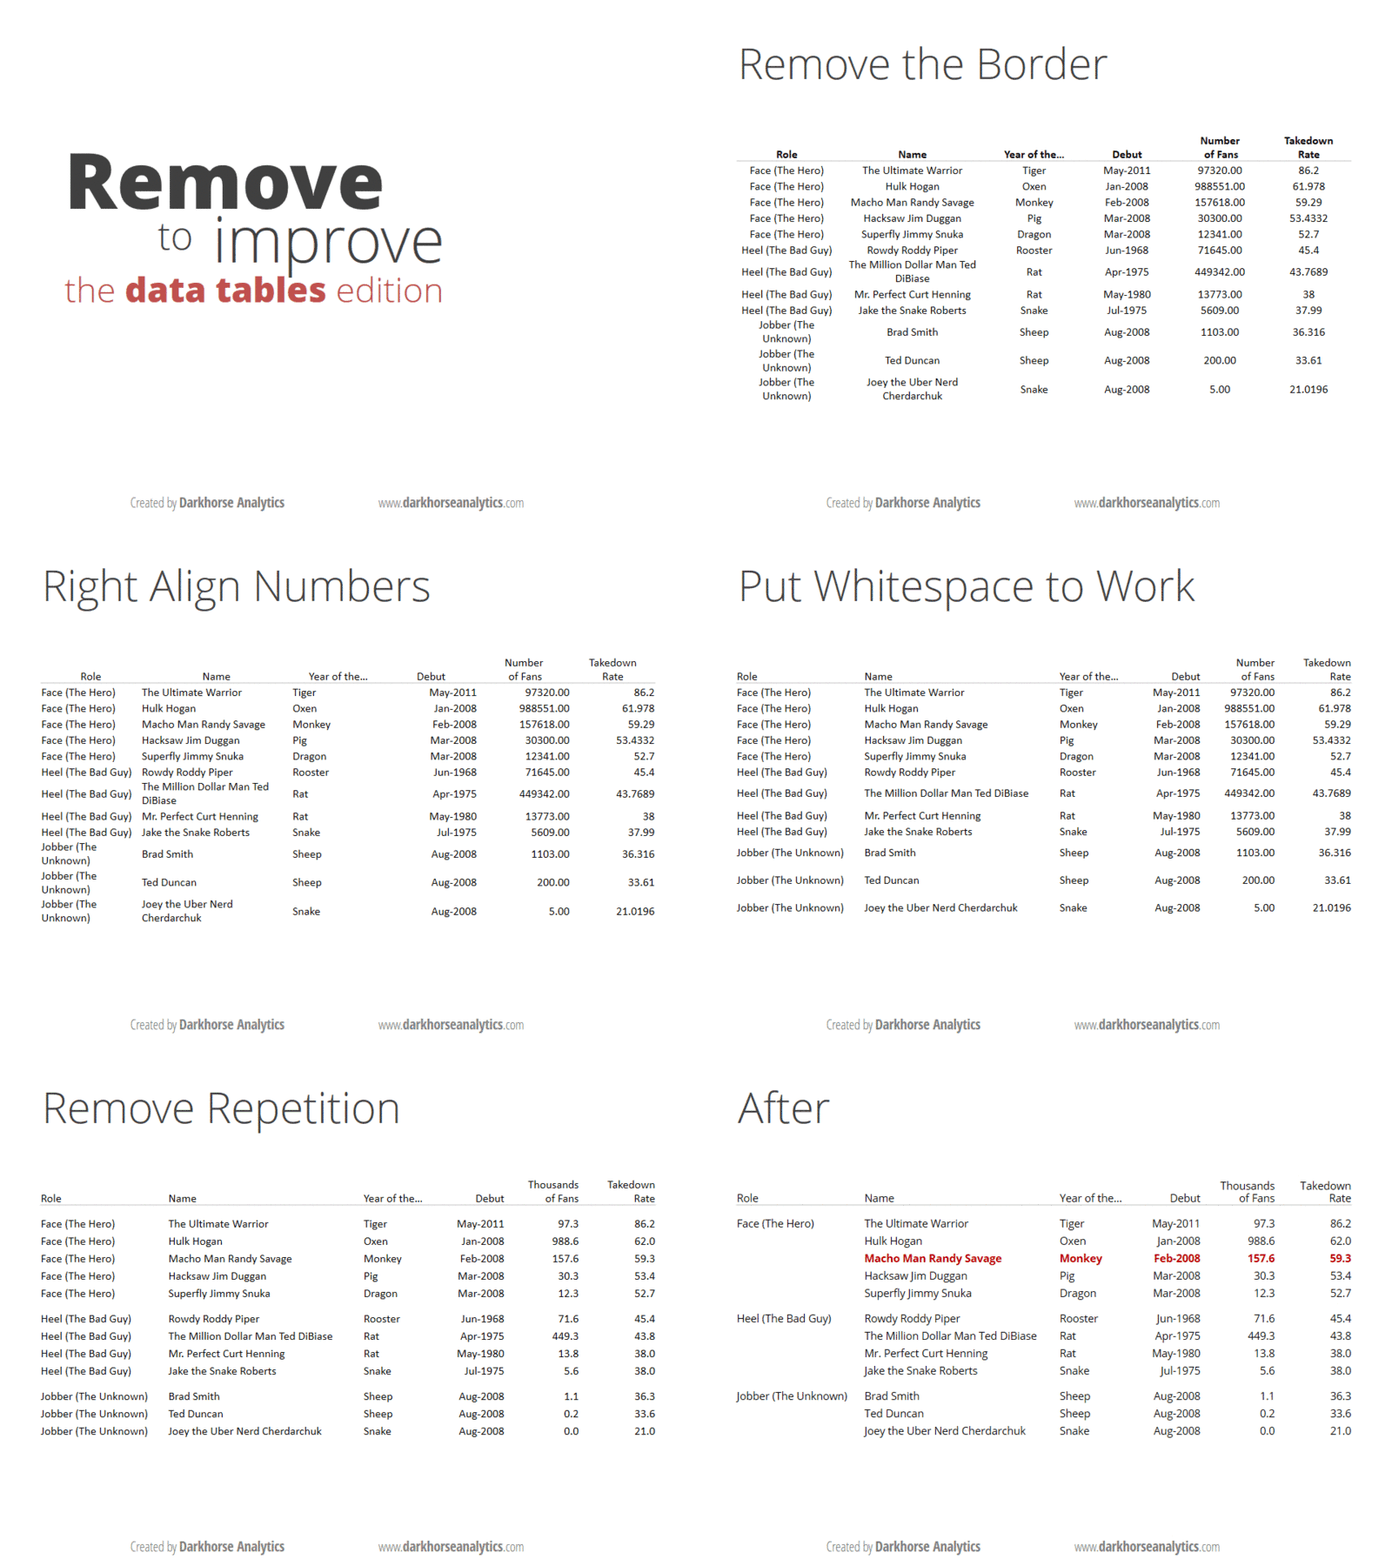
If you are going to use colors, make the colors meaningful. Why is this row dark? Why is this row lighter than the others? There should be a reason other than "this line happened to go after this other one".

https://i.imgur.com/ZY8dKpA.gif

Who doesn't use stripes

Who uses stripes

Net result

  • Apparently multi-billion-user projects choose no stripes. Be like them :)
9
  • 6
    Have you ever had to work using printed and digital long tables before? I don't agree with this answer. Although this graphic (which I've seen many times before) cleans up a table, it removes an at-a-glance visual separation between rows. The marked correct answer correctly identifies that either zebra stripes or a line between are required. Your graphic example doesn't have separation. Gmail has a line between rows, as does Excel, Google Sheets, iOS tables, and Android Material Design. OS X Finder view uses zebra striping. OSX Icon and column views are NOT tables so they are not relevant.
    – Davbog
    Commented Mar 5, 2019 at 22:35
  • 1
    It's ok to disagree. You are disagreeing with Edward Tufte though. My main issue with zebra coloring is the cognitive dissonance that having rows with different colors bring. Why is this row different from this other one should have meaning. Commented Mar 5, 2019 at 23:11
  • 5
    Why not use Calibri?
    – ralien
    Commented Mar 6, 2019 at 15:58
  • 2
    The animated example relies on some very specific preconditions and therefore does not seem convincing for the general case. In particular, there are precisely two steps ("Put Whitespace to Work" and "Remove Repetition") that transform the tabe from an unscannable mess into an appealing result, and these two steps only work because of the very peculiar situation that the displayed data can be conveniently grouped into sets of no more than four items each. (I am disregarding the first group here because IMO, those five lines are well readable precisely because a zebra striping substitute ... Commented Mar 10, 2019 at 18:17
  • 3
    Upvote given for referencing Tufte in your answer. A single tear was shed when the last part of the answer said (paraphrased) "copy what popular companies do".
    – Benjamin S
    Commented Aug 7, 2020 at 15:29
5

For large data sets, I'm a fan of slight gradient for each row. A slick annual report I saw a few years back made the effect by alternating the row border bottom colors like #333 to #666.

+1 Lie Ryan for the hover effect. Our time tracker highlights the rows on hover. Lifesaver. AND what's more, it provides additional data in the tool tip pop-up. Gradual engagement win.

4

The goal is to make the data easy to read and scan. Zebra stripes are but one element that can be leveraged to assist with that.

Often, they are abused, and become chart junk.

I'd suggest that they should be a last-option tool. If the layout of the data can not hold together in easy to scan rows, then toss in the stripes. But be extremely subtle with them to start with.

3

I don't know of any research on this field, but if you take alot of rows and columns in Microsoft Excel and compare them with and without alternating backgrounds my experience is that it's much easier to know what column is connected to what row, especially if you want data from the rightmost column and you use the first (leftmost) column as the reference.

3

Since humans easily group things into bunches of 3-7 (depending on the human), I've always wondered why the zebra stripes are per-row rather than per-bunch.

I've also found a highlight on mouseover (or click if you want to support touchscreens like smartphones) to be helpful - a bit like a zebra stripe that only appears to visually group the specific row you're interested in at the moment.

If you are going to use any of these visual-grouping backgrounds, separating them as they did in the image you posted as an example is a strict no-no. The visual breakup by the table cell padding is jarring.

7
  • 1
    +1 for the mouseover-highlight; it's like reading a printed table with a ruler. Commented Feb 16, 2011 at 20:48
  • 3
    Zebra stripes per-row or per-bunch... Well I guess that kinda depends whether you are trying to differentiate between rows or bunches? For regular tabular data, I think per-row will be more common.
    – MrWhite
    Commented Feb 16, 2011 at 21:12
  • Your suggestion that the row should be highligted when clicking on it on a touchscreen has its limitations. A common scenario is that the reference column is the first, hence the leftmost. If you have to touch that one to highlight the row, your hand (if right handed) will cover the entire screen for each click wich can can have negative impact on the work flow. Commented Feb 17, 2011 at 9:19
  • 1
    Old-school green bar line printer paper grouped in bunches of three, e.g. pdp8online.com/images/greenbar.shtml. I've always found that easier to read than alternating rows. Commented Jan 13, 2014 at 18:31
  • 1
    @GeraldCombs: The example immediately makes me wonder how sample lines 1 to 3 belong together, while, for instance, sample lines 3 and 4 do not. Commented Jun 22, 2017 at 10:57
3

Alternation of background color in rows helps with accessibility for users who have vision problems. One example is scotopic users, who without the right colors or alternating rows may end up reading the same row over and over among other issues. Here are some of the symptoms of scotopic vision:

  • Discomfort with busy patterns, particularly stripes ("visual stress" and "pattern glare")
  • Discomfort with extreme conditions of bright/dark contrast (i.e. backlighting)
  • Discomfort or difficulty reading (reading involves busy patterns, particularly stripes. People with strong symptoms of the syndrome find it very difficult to read black text on white paper, particularly when the paper is slightly shiny.)
  • Text that appears to move (rise, fall, swirl, shake, etc.) Losing text content and only seeing rivers of white through the text Words moving together becoming one unrecognizable word

This list is misleading when it says stripes because of the subject matter, however, the text itself is the "stripes" and the striping in the table is actually what breaks that up and makes it easier to read.

1
  • 1
    Genuine question: You say that zebra stripes will help scotopic users... but the first bullet point specifically says that stripes cause visual stress. Is this not contradictory? Commented Oct 17, 2017 at 20:21

Your Answer

By clicking “Post Your Answer”, you agree to our terms of service and acknowledge you have read our privacy policy.

Not the answer you're looking for? Browse other questions tagged or ask your own question.