3

I want to display three metrics on a graph (in descending order of importance):

  • Level of session
  • Date/time of session
  • score

enter image description here

The % fill of the circle represents: Green: how close they got b/t Pass and 100% Red: % between 0 and passing score (perhaps this should be reversed : bigger for lower score (so Radius = (PassingScore-Score)/PassingScore Any other suggestions on how to do this?

I've considered:

  • Size of he circle (removing the outer circle).
  • Color shade of the circle (but 100% filled)

2 Answers 2

2

Assuming that all the metrics are effectively continuous (i.e. they don't fall into just a small number of discrete categories), and that what you want to visualize is the evolution of the subject's educational progress over time, your proposed design looks about as good as anything I could come up with.

However, I would have a few suggestions for the marker color / diameter coding used to represent the score:

  • Make the inner circle radius run from 0% (zero radius) to 100% score (max radius), independently of the pass threshold.

  • Used something else, in addition to color, to indicate whether the lesson was passed or failed. For example, you could make the inner circle hollow for failed courses, or maybe draw a diagonal bar or cross across markers for failed lessons.

Together, these changes ensure that the chart remains fully readable even if it's printed in black and white, or even if the viewer is color-blind. Making the radius a monotone function of the score also lets the viewer get a general overview of the scoring just by looking at color density across the chart, without having to distinguish failed from passed lessons.

Edit: Here's a quick mockup of some markers, as suggested above, for a range of scores:

                                              Pass/fail markers

0

I would not use shade. Shade has no conceptual mapping to a score and would be more difficult to distinguish from one shade to the next -- I'm assuming you're using a shade of the same color (e.g., green) vs. different colors. Different colors would still have no visual mapping to "score".

Here is an example:
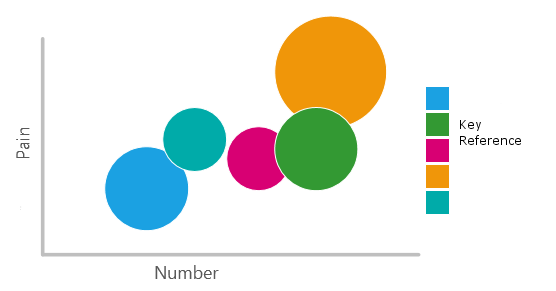
enter image description here

(note: I've removed some specifics from the image)

This sounds like what you mean by "size of the circle". This chart gives me an idea of "how many to-do items" and a "pain score" on the axis. The size of the circle reflects how popular the category is.

I can quickly gather that Orange is very "painful", has a lot of "to-do items" associated with it, and by the size I can tell that this area is pretty popular. Alternatively I can see that Blue is not as "painful" as "Red", but is more popular (I can explore to find out why)!

UPDATE:

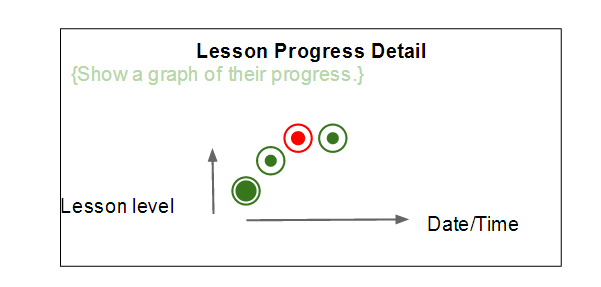
I would point out though, that you're actually showing four metrics on a 2D graph:

  • Lesson Level
  • Date / Time
  • Score
  • Pass / Fail

So, having the bounding circle to show a 100% threshold does make a lot of sense.
Your Answer

By clicking “Post Your Answer”, you agree to our terms of service and acknowledge you have read our privacy policy.

Not the answer you're looking for? Browse other questions tagged or ask your own question.