0

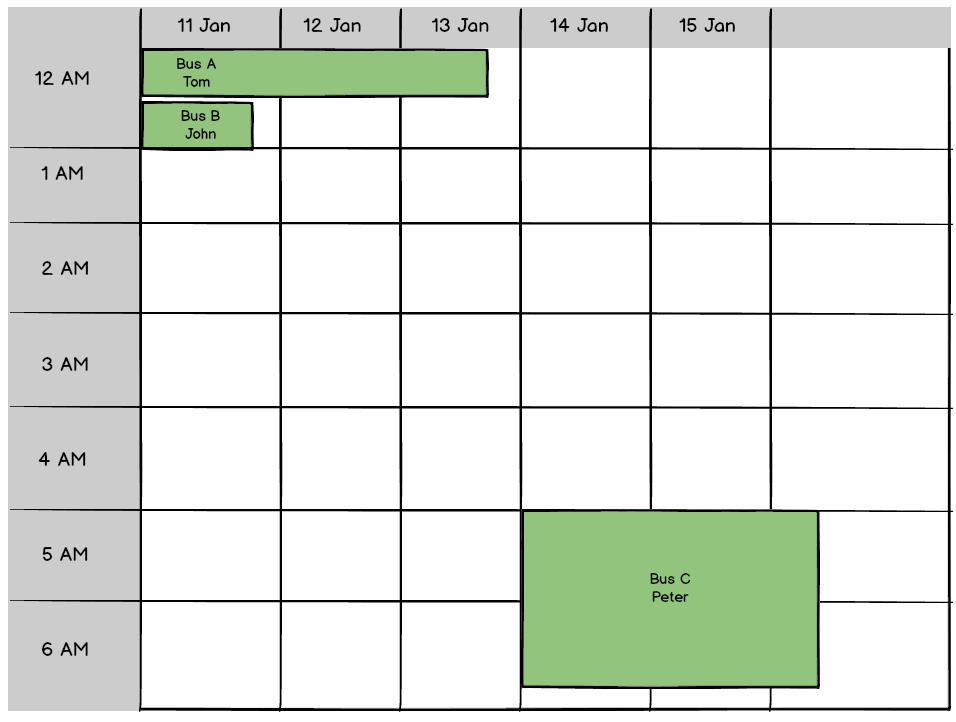
At my job, I need to create a calendar that shows the days and time slots in each day, and in each slot, I need to show what are the buses that are out each day, who are the bus drivers etc.

This is what I come up with:

enter image description here

Now, here's the problem:

Look at Bus A and Bus B.

If Bus A is instead booked from 12 AM to 4 AM, how would I show that on the calendar, without blocking the Bus B graphic?

And to complicate things, if Bus B is booked from 12 AM to 3 AM, how do I show it without overlapping other blocks?

Basically, on each day, there can be multiple buses going out at all around the same time etc.

I've looked at project management timeline UIs, calendar UIs but can't find anything similar to what I'm trying to do.

Can this sort of data be shown on a calendar, or is it impossible, meaning I've to use tabular list data?

1
  • 1
    Why can't you have 3 instances of Bus A - one on 11th, 12th and 13th? I don't really see why it has to be one single block when you're working with individual days.
    – JonW
    Commented Nov 21, 2016 at 15:10

3 Answers 3

3

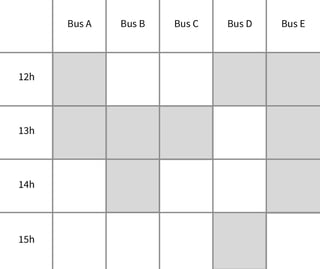
If you can make a table for each day it will be easier to understand the schedule of each bus:

day

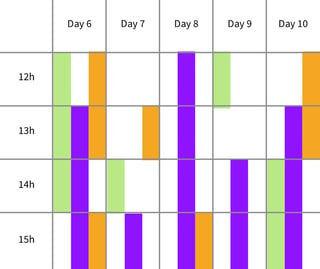
Otherwise you need to divide each day column into sub-columns for each Bus, with a legend for the colors:

week

BusA: Green, BusB: Purple, etc.

1

What you're looking for is really complex. You could use a 3-way matrix (see this page for explanation and examples or this one for 3,4 and 5 ways) if you're OK with using tables, or you'll need to go deep on Adjacency Matrices for graphs . If this is your first time at these concepts, then they're really interesting and important, but be aware: they're NOT easy.

However, if you want a simpler solution, you need to ask yourself these questions:

  • What do I need to represent?
  • How do I need to represent it?
  • Why do I need to represent the elements of this specific architecture?
  • Which elements do I need?

There are many more questions, but for starters, it's a good beginning. See Alavaro's answer where all these questions were answered for 2 different solutions.

Now, the thing is: your 3-way matrix could be easily rebuild in 2 views of 2-dimentional information. It's really unlikely that you'll need the 3 ways at the same time. And even if you need it, it would be very difficult to visualize (as you accurately describe in your problem)

Also, using the 3-ways with a bar graph on a grid will have a massive cognitive load, since at first glimpse all buses would look as if they're taken for entire days (as in your example for Tom)

So, my solution would be:

  • Create a grid where you discriminate hours for each bus/driver on each single day (see Alvaro's example)

  • Create another view with occupancy per day. Here you can use a table with numerical data.

See the following example:

Bus  |   Day 1   |   Day 2   |   Day 3
----------------------------------
Tom      3 hours     4 hours     0
Nick     1 hours     0           3 hours
Ryan     4 hours     2 hours     1 hour

This way you'll be able to visualize the important information you need while being able to add totals and simple graphs.

Finally, if you really need all options at once, you can try this:

enter image description here

Where the user can scroll the times up to end of day, with a clickable element to go to next day that also has the information for the following day. But again: previous solutions are cleaner and more elegant

0

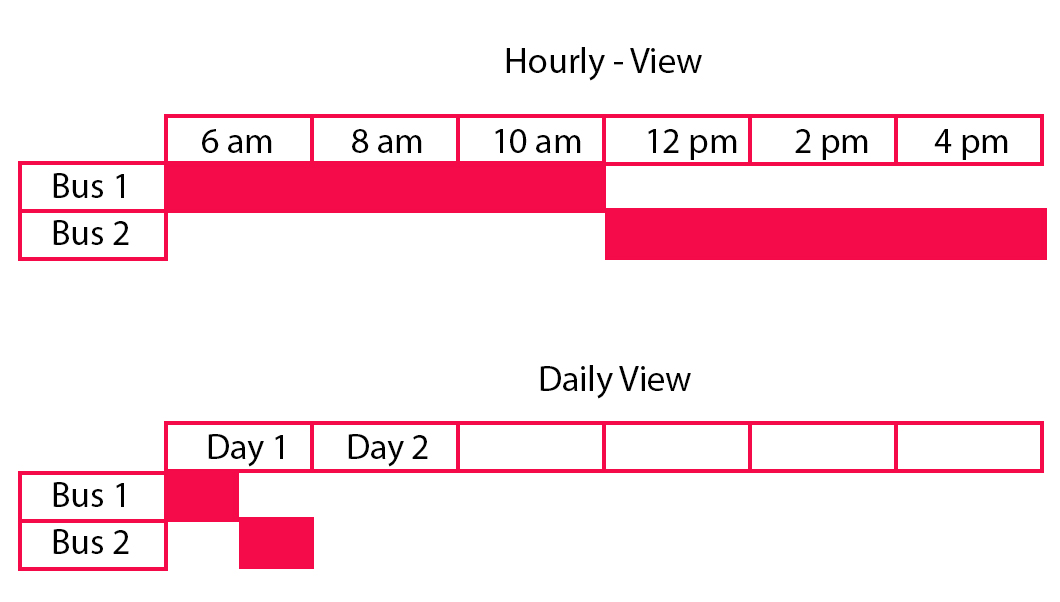
Let's not get too geeky, and do it the lazy way. What got you stuck is time. Time is time whether it is minutes, days or years, what differs is the scale, not the characteristics.

Once you see this the problem becomes simpler and the approaches of solving it are different.

This is an example where the user can zoom in and out of the view to scale time.

enter image description here

2
  • so basically you did an image for what I said. Sometimes been geeky pays ;)
    – Devin
    Commented Nov 22, 2016 at 23:16
  • Haha, by geeky i was referring to the 3rd metric @Devin. I might have not quite understood your answer well.
    – UX Labs
    Commented Nov 22, 2016 at 23:19

Your Answer

By clicking “Post Your Answer”, you agree to our terms of service and acknowledge you have read our privacy policy.

Not the answer you're looking for? Browse other questions tagged or ask your own question.