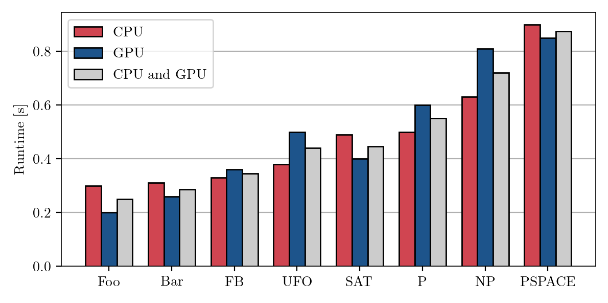
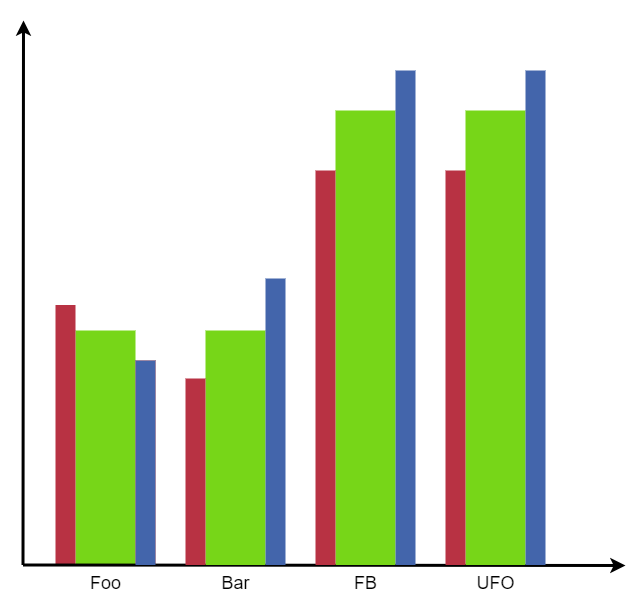
I am presenting results from an experiment in an academic publication. Here is what the figure currently looks like:
The gray bars are the averages of the red and the blue bars.
Goals
- I want to show the reader how the methods perform on average, as displayed by the gray bars.
- I would also like the reader to be able to compare the methods based on the red bars and based on the blue bars.
Problem
Right now, the visual complexity is quite high and the repetitive color pattern makes it hard to immediately see what's going on.
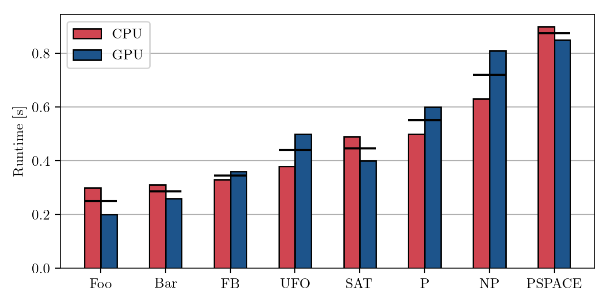
I have tried removing the gray bars and displaying them as horizontal lines between the red and the blue bars, but that did not look good either:

