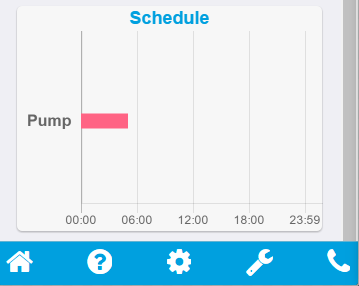
So at my job I have been tasked with the designing, development and implementation of our customer based application. We already have one however it is out-dated in terms of style and functionality. Long story short: Our customers wanted the ability to see time-series data that was associated to their account and have it represented in the application. The simplest solution was to generate a graph that took that information from the server and displayed it visually, as you can see below.

Please ignore the scroll-bar - Cordova adds it into the emulator however it doesn't appear on a device.
That's just an example of one device that is associated to that users account. Most customers have 2-3 devices so they are simply stacked on top of each other. The user is quickly able to see that their 'Pump' device runs from midnight-5am.
However: I have never been too sold on this design and although all of the internal stakeholders agree that it is 'good', I am not satisfied. I always ask my SO (significant other) for her opinion as well and she shares the same views with me that being: "Is there another way to display that graph or information? It's okay but could probably be better".
So TL:DR - Any advice or ideas on how to better represent a time-series based data?
