0

I am working on web development project that will let warehouse managers view their employee's performance.

There are nine different tasks that an employee does repeatedly throughout the day. The details of each task as they are completed are stored in a database.

The managers want to see the number of times each employee completed these specific tasks in five minute time blocks throughout the work day.

An algorithm looks at each 5 minute block and determines if the performance for each employee in that block was at or above expected levels (the block will have a green background) or below (the block will have a red background).

The screenshot below shows what I have come up with so far. I am currently using Bootstrap's tools to build the layout. The problem I am running into is browser sluggishness or outright crashing caused from the sheer number of html nodes (elements) that are required to render the view.

I am looking for suggestions on alternative techniques for displaying this information. I am thinking of perhaps using ImageMagick to build a single image for each employee that shows the same data but I am not sure if it is possible. I am open to all ideas but remember it needs to work in a web browser.

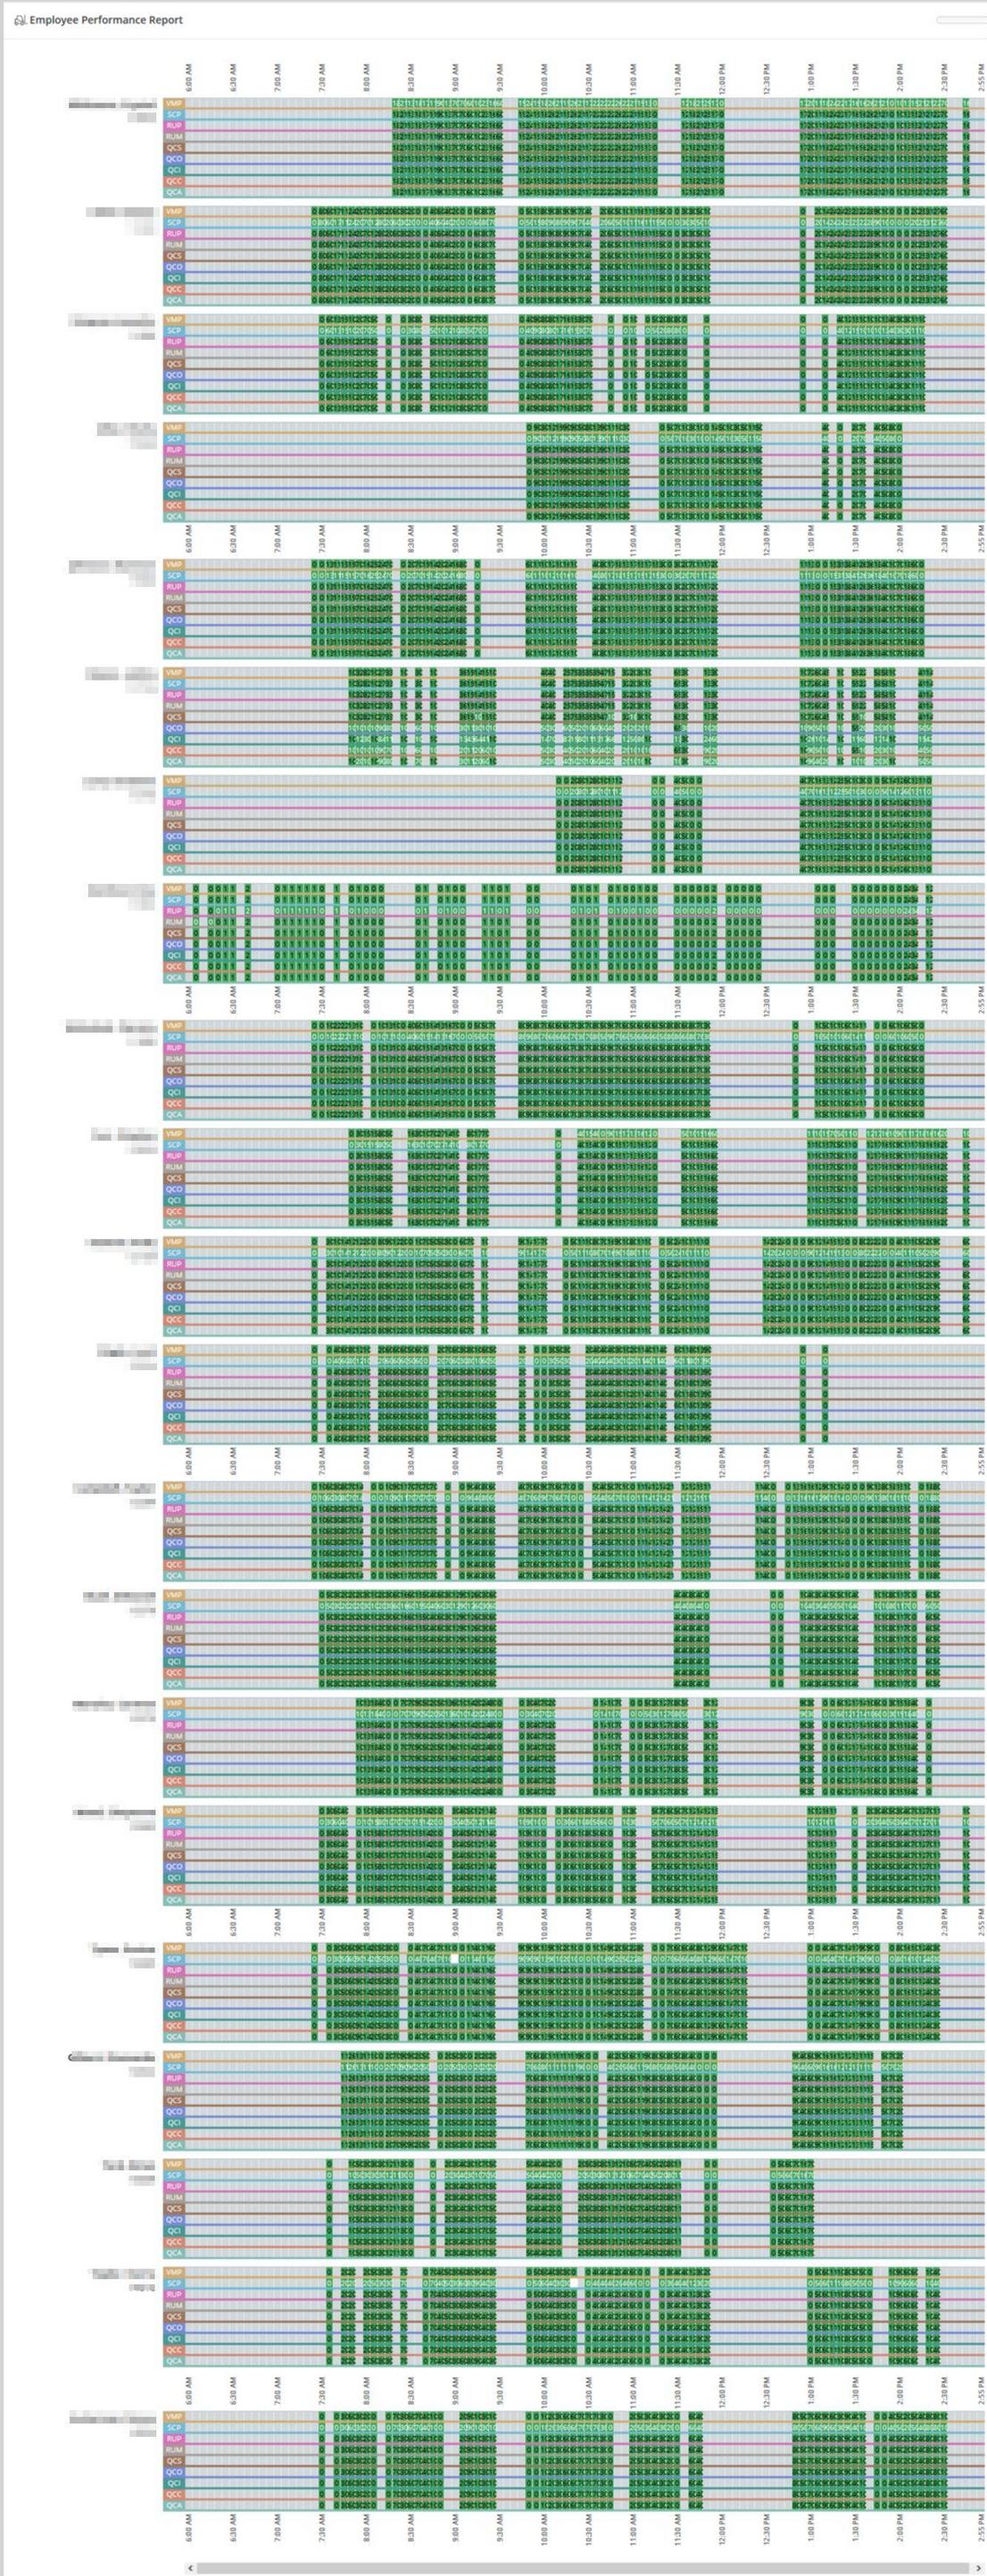
Employee Performance Report Example

5
  • 1
    The question in current form is asking for implementation suggestions, that's not what UX SE is for. But maybe it can be an UX question if you turn the performance problem into a usage problem. Is this much data on one screen even useful? Do managers compare/read all the data at once or do they prefer to see smaller bits that they put together themselves? Or do they just scan for patterns? Because there are other ways to solve that.
    – jazZRo
    Commented Nov 18, 2020 at 15:45
  • Thank you. I am not familiar with all of the various stack families. I apologize for posting this in the wrong one. As far as your questions - yes, they do want to see all employee's at once for the current day and yes it is to look for patterns - specifically for employees under performing. Yes, they also want to view smaller bits - such as just one employees performance data over a longer period, such as a week. And yes, they want to compare selected data, such as the data from a known above average employee to that of an under performing one.
    – Drew
    Commented Nov 18, 2020 at 19:35
  • Also, which stack site would this question be more appropriate for?
    – Drew
    Commented Nov 18, 2020 at 19:38
  • As the question stands now you are asking for the interface to be designed for you from beginning to end. You could break this up and ask for the first step which would be how would you perform research in order to get started. If you want to leave the question as is, there may be a visual design stack exchange.
    – Johnny UX
    Commented Nov 18, 2020 at 21:53
  • I am just looking for "alternative techniques", aka references to existing libraries or design patterns that I can look into.
    – Drew
    Commented Nov 18, 2020 at 22:51

1 Answer 1

0

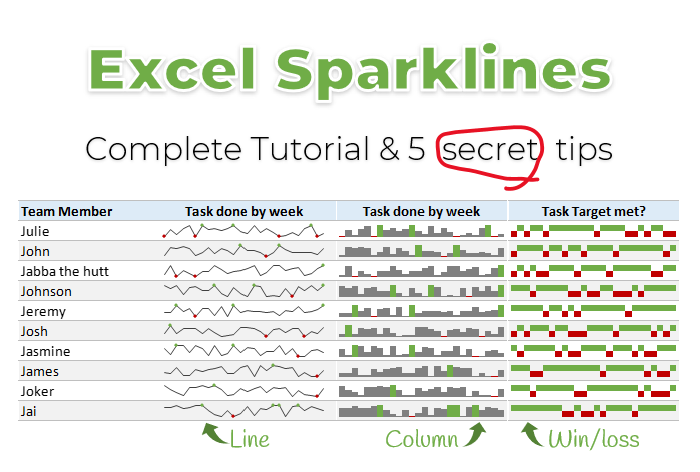
I think you might be interested in something similar to sparklines in Excel, where you can summarize very dense information in small multiples to create a more visually distinct and easy to scan structure (see image from link on sparklines).

It just so happens that the example that I sourced from the site also shows number of task performed, and in Excel you can display this type of data in one of three styles.

enter image description here

Your Answer

By clicking “Post Your Answer”, you agree to our terms of service and acknowledge you have read our privacy policy.

Not the answer you're looking for? Browse other questions tagged or ask your own question.