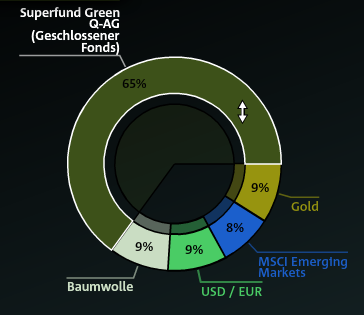
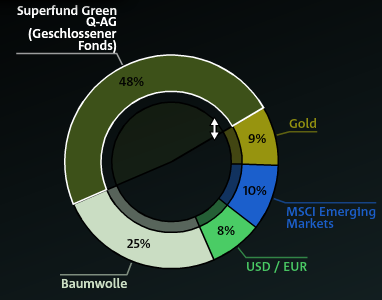
Following on from Christian's comment, I had a look at the Superfund ring-chart. Each segment goes live when the mouse hovers over or near it. By clicking and dragging the mouse up or down, the value of that sector increases or decreases respectively.
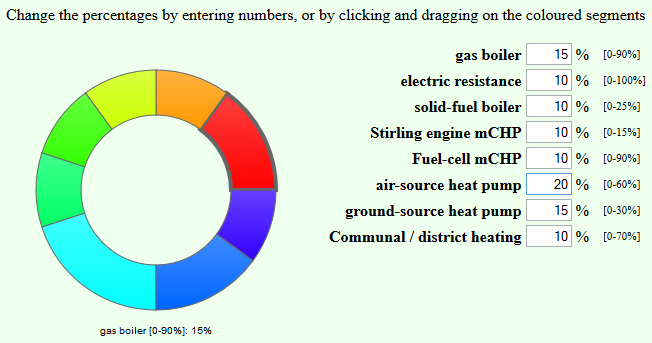
Using Raphael JS, I produced something with similar behaviour, and with linked input text boxes, to give two ways to enter the data:
But I haven't been wildly happy about it: it wasn't really that intuitive.
So I'm now working on a redesign using a modified version of the Jquery multislider widget: (screenshot to follow shortly)

Values can be changed by dragging the separator bars, by entering numbers in the text boxes, or by pressing up and down when the cursor is in one of the text boxes.


