Having read all the answers so far, I feel like a mathematical approach can be of value.
A waiting line/queue is typical version of a Markov-chain.
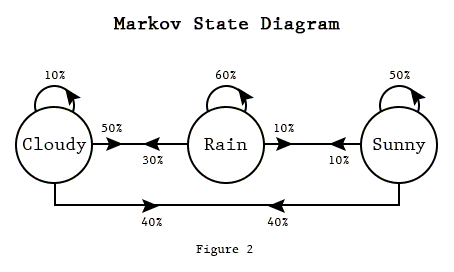
A Markov-chain is a network of states. For a waiting line, this are usually the nr of customers in the total system (the nr of customers waiting in line plus the nr of customers being served). States change according to a certain probability which is different for every state (transition probabilities). 
How can we use these probabilities?
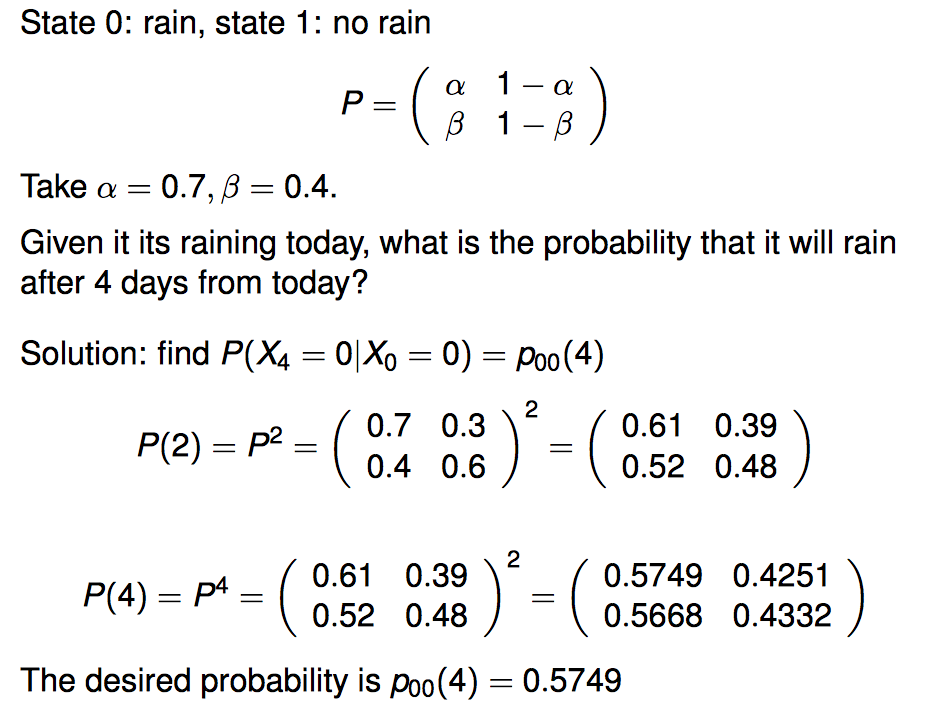
lets use the following example (Ross 4.8):
Four day weather forecast

These probabilities are usually described by a Poisson process. A poisson process is a mathematical representation of probability over time (note that this is not entirely true but it does give an idea of how one could approach it). In other words: how many of a certain event do I expect over an amount of time. For instance: How many car accidents do occur on a certain junction in 10 days (If that is 2 that may seem very high but since there can be many cars passing, the probability of an accident happening when one passes the junction can be very low).
A more on-topic example is, how many customers do I expect to arrive to the drive thru lane? This immediately brings up the question how much time will it take before the next customer arrives. We call this inter-arrival time.
One can see that the values from P^2 to P^4 change less than the values from P^1 to P^2. What does this mean? Can we use it? Lets assume the values in matrix P^1 represent reality. Of course it doesn't, but lets assume it does. The truth is it converges to a point which is not dependent on the state of today anymore, because, the further in the future you go, the less today is of importance of the future. This describes the memory less property of an Exponential probability distribution. To find these so-called steady state probabilities, one should calculate the matrix P^Infinity. Sometimes this is easy, sometimes it's not because not all matrices/probabilities converge. Some matrices diverge. An illustration to this: What if the average interarrival time to the drive thru is larger than the average drive thru's service time, and the drive thru would be of infinite length? The system would "blow up" meaning that waiting times will only grow larger. In reality this is never the case since a drive thru has only a certain length.
what can we do with the steady state probabilities?
We can calculate the average waiting time of a customer in the system. We can calculate the amount of numbers expected to be in the system and we can calculate the expected utilisation of an operator (and many more things).
Lets say a company adds a lot of value to service. Waiting is often regarded as not adding value to service, since, of course people don't want to wait.
The company can now calculate the costs/benefits of having an extra operator/drive thru lane and see if that adds value to the company. Maybe the company now gets more customers since even though there are more customers in total, the total waiting time is lower.
Something I'd also like to add is: I once made an analytical (markov chain) model for the parking garage of a hospital. This hospital had 2 entrances, one on the north side and one of the south side. The hospital asked me why, even though they had 2 entrances, people were still complaining about the waiting time. What was the case is that no one was using the north entrances because not many people arrived from that side. It is often better to have one central waiting line that separates into multiple servers.
From the customers' view it is often better to stay in your line: ht tps://www.you tube.com/watch?v=xvQjTvktTKI
(since I don't have enough reputation just yet I needed to cut the link above in half to be able to post more that 2 links (other 2 are images) I'm sorry to do it like this but I don't want to let it out)


