How can I represent the changes between two rows of a database similar to the split diff of GitHub?
Context
I would like to visualize the changes made to a table which are happening over time. For instance, LHS would be the table from one week ago and RHS would be the current value of the table.
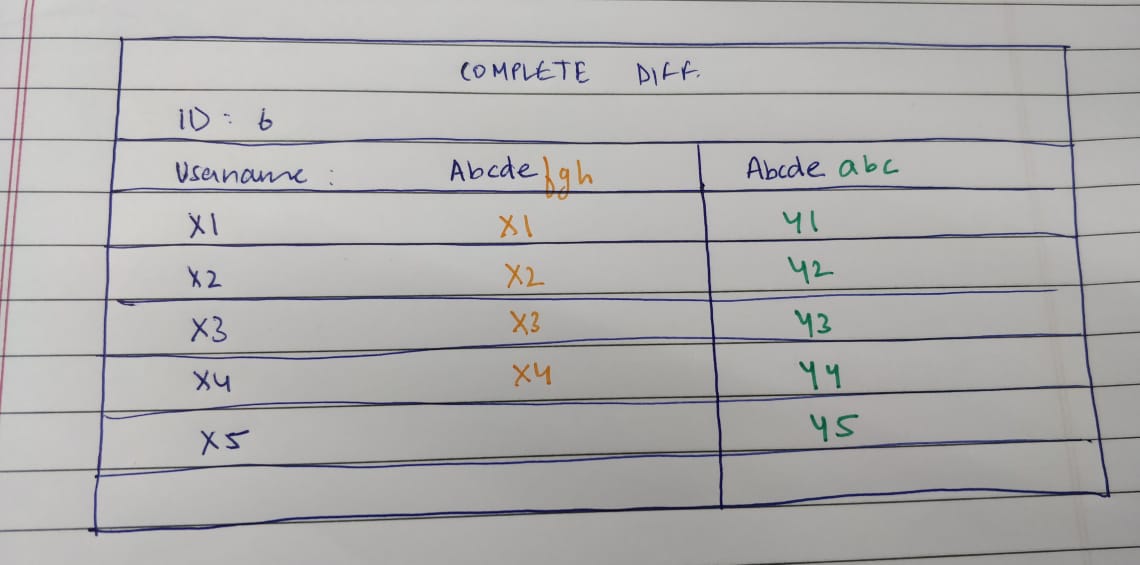
Since there can be a lot of changes and showing all the changes at once can be overwhelming/confusing. Hence, I want to show a condensed version of the changes as shown in the first image. If the user clicks on View All Changes button, I want to show all the differences between the rows.
Problems
The main issue is the identification of each row. How do I convey to the user which row's difference they're viewing? For now (image 1), I am showing all the columns of the row with a limit on the max string length after which it shows '...' and on hover, it shows the entire string (just like Chrome's network tab does). Not every row has an ID (or row number) or primary key so I can't just use that.
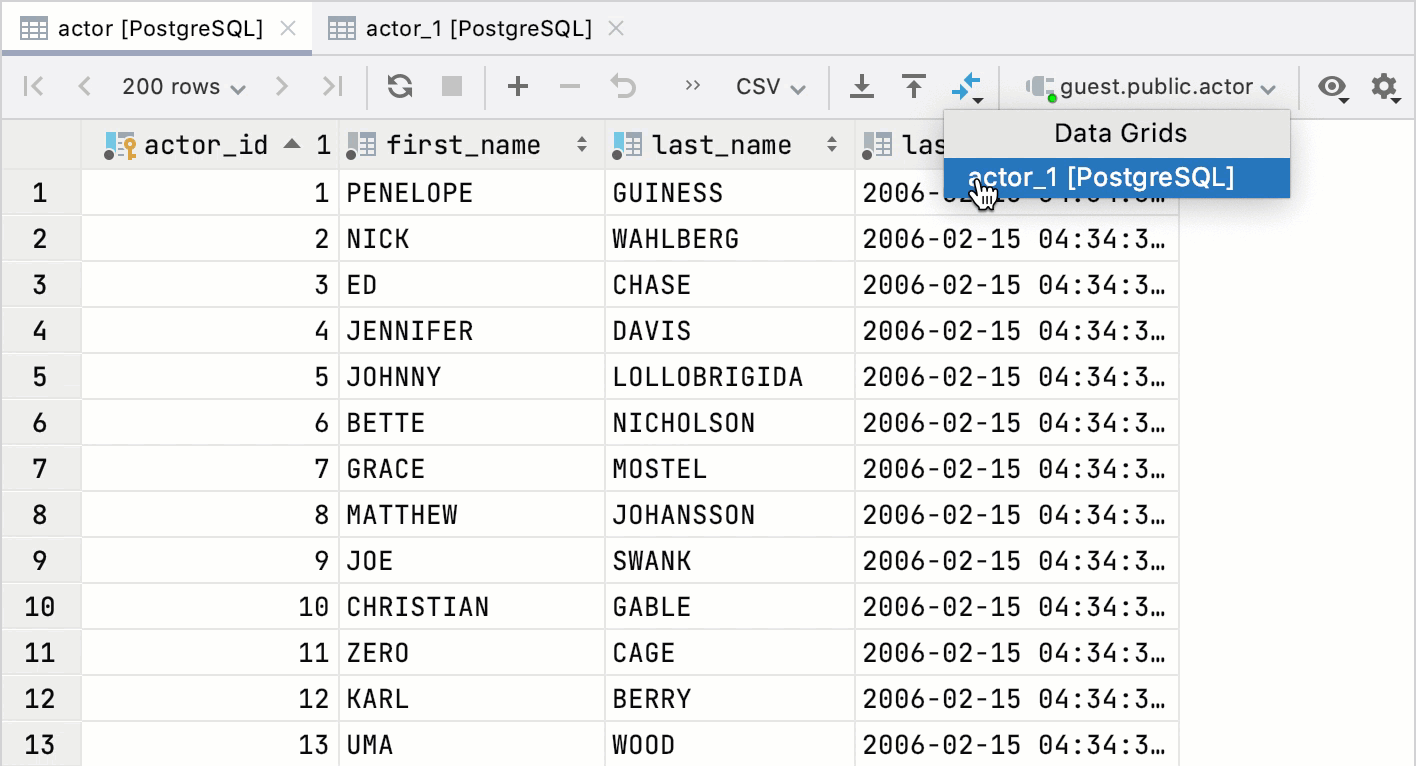
Secondly, the difference is calculated for each column in a row. Once the user clicks on view all changes, how do I represent column wise difference? Currently, I am doing it as I have shown in the second image using a modal/popup.


