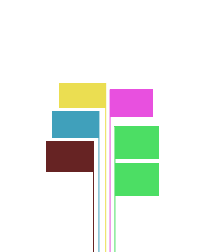
In addition to a changelog-style data display tool, I am adding a timeline that visualizes when these changes happened. The timeline should be infinitely variable, with the possibility of zooming in out to change the total length of the timeline between a day and even several months. The event items should always stay clickable to show details. The events do also belong to different groups, that I'd like to display with colors.
I initially came up with a simple 1-D timeline, that uses horizontal bars to display the events. Since the events apply to only a point in time, making the bars wider would also mean the actual pointer on the timeline gets more inaccurate. Thats why I came up with those little flag-like markers, that are both accurate and also provide a larger click-area.
Now the point where I'm stuck is when several events get very close to each other, especially when zooming out. The points will wander together until they are not distinguishable any more. The solution to merge the pointers and displaying a number on the flag seemes to be a good solution, but when events of different groups merge it can get very frustrating.

Do you think my solution is sufficient in terms of usability? Can you think of any other solutions?


