6

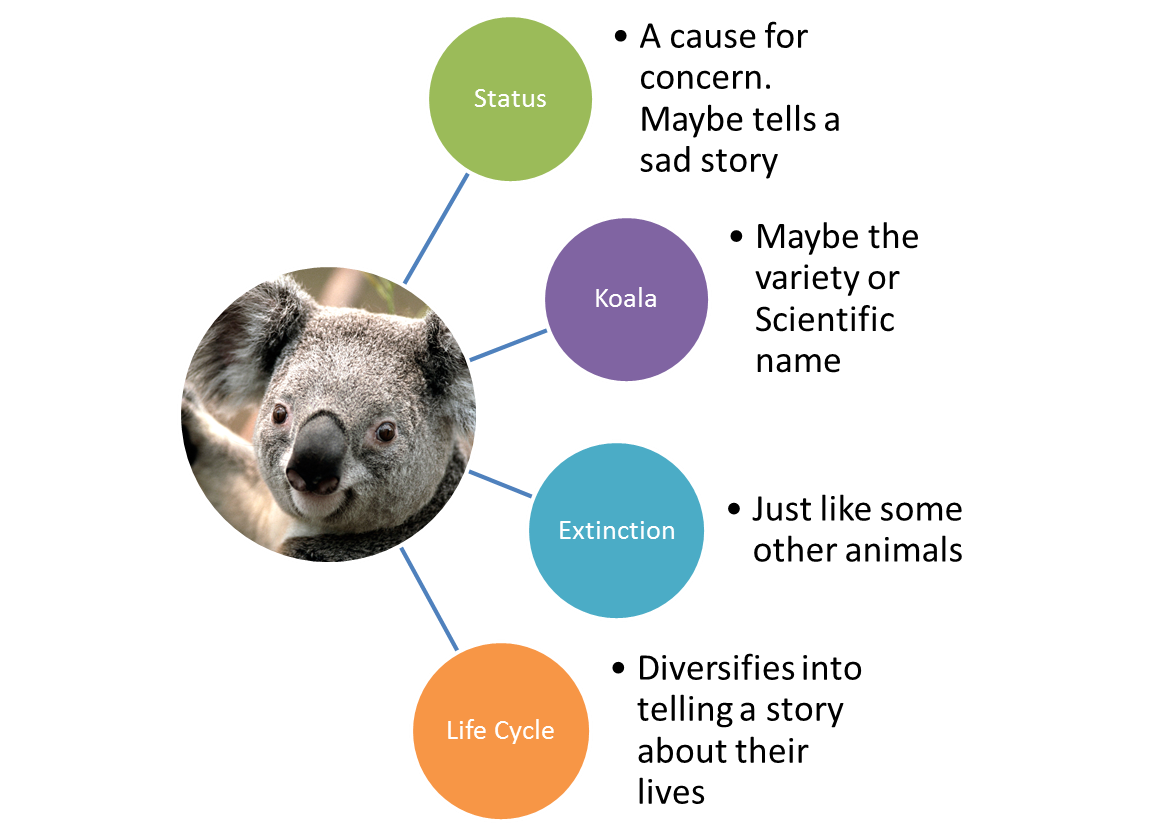
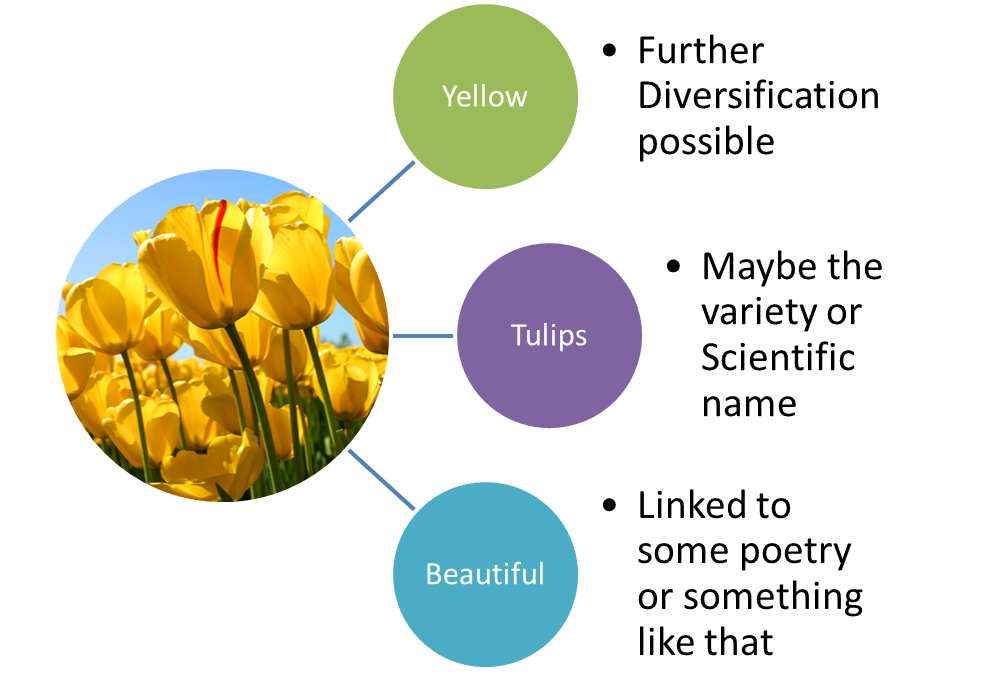
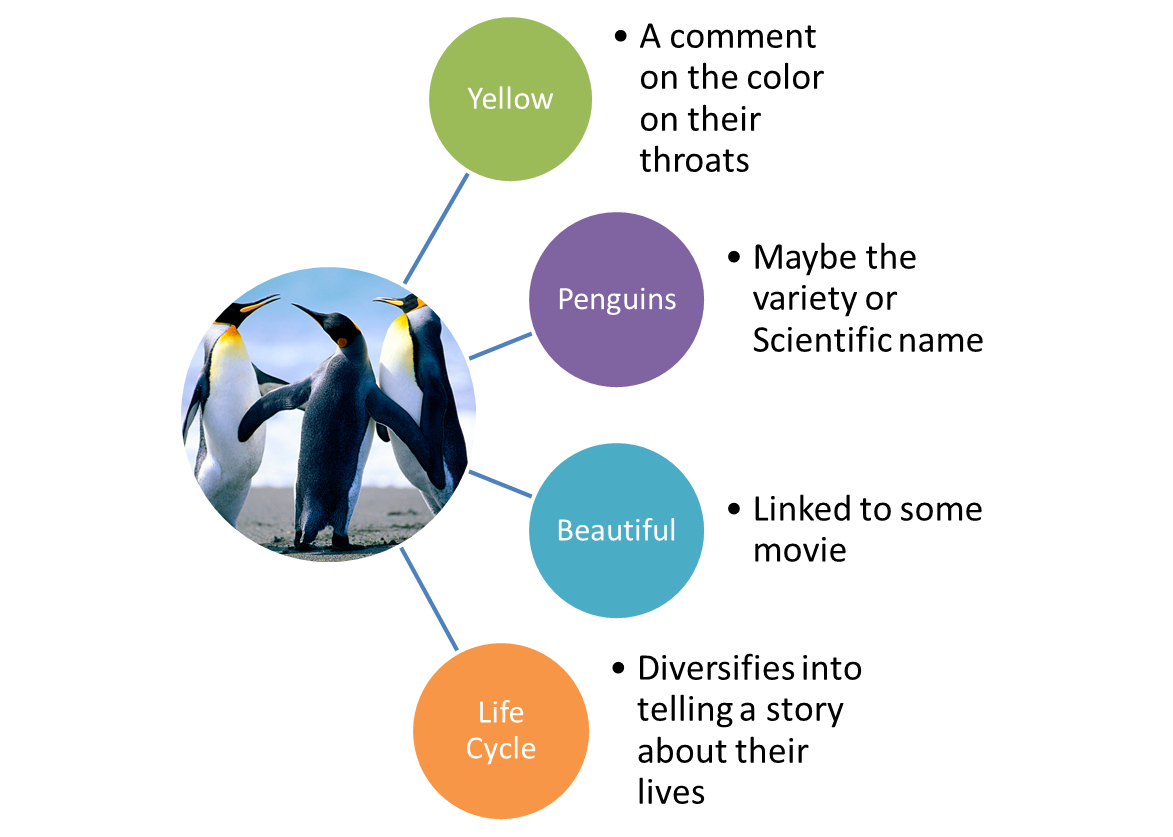
Let us have the following three sets of information
alt text


alt text


alt text


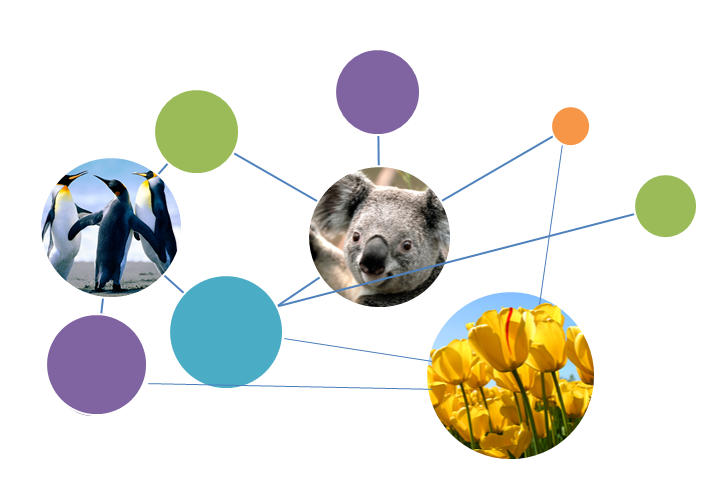
Now I want to combine all of this data and show it all together. Telling it like a story. Giving inter-relations. Showing similarities in terms, concepts etc. to get the following (Note that in the diagram below, the colored relations may not be exact, they are merely indicative of a node of information)
alt text

Question: Is there a good way to do it. Also, Is there a tool available for doing this?

I hope this make the question much more clear. :)

I have posted this question originally on stackoverflow here so you can take a deeper look to understand my question better.

7
  • What is your question? If you are asking for a program to visualize something, I do not think that you are asking on the right website. Commented Nov 1, 2010 at 15:57
  • Rather, I am asking for a solution. Which means that "a way of showing relations" between things
    – OrangeRind
    Commented Nov 1, 2010 at 16:23
  • You need to give us some sample data to understand what you are after. Right now the request is too vague - we could provide charts, graphs, maps, Venn diagrams etc. but without an idea of the data you are trying to show we can only wildly guess.
    – scunliffe
    Commented Nov 1, 2010 at 19:03
  • The question is unclear. You can edit it. :) I voted for your question because the answers are interesting.
    – JeromeR
    Commented Nov 1, 2010 at 19:33
  • @JeromeR there you go! :)
    – OrangeRind
    Commented Nov 1, 2010 at 23:11

2 Answers 2

3

Maybe this one

ADDED:

and use it with combination of Topic Map to find out associations, occurrences(number of occurrences to size "circle") between topics (entities).

4
  • this is brilliant!
    – OrangeRind
    Commented Nov 1, 2010 at 19:17
  • now with the updated question, lets wait for some more answers to creep in.
    – OrangeRind
    Commented Nov 1, 2010 at 23:12
  • @OrangeRind I have updated my answer :)
    – igor
    Commented Nov 2, 2010 at 6:21
  • I think topic maps quite sums up what might be needed! Thanks!
    – OrangeRind
    Commented Nov 2, 2010 at 10:02
2

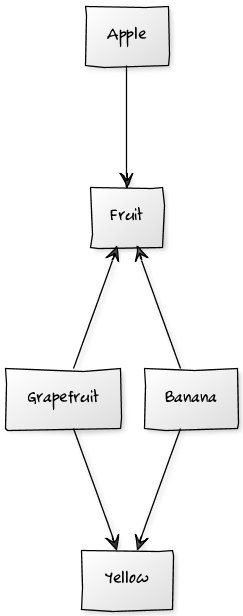
If you are trying to "visualize" relationships between 1 or more things you may find a tool like this very handy. Not only does it let you visually build a picture with simple text, but it handles many of the "odd" scenarios that might otherwise be hard to indicate.

alt text

2
  • +1 it is nice, but it is not free tool. :(
    – igor
    Commented Nov 2, 2010 at 6:24
  • @igor - on the contrary it is! see the FAQ: yuml.me/faq "Q: Is it FREE? A:Yup! This site is a free service - enjoy!" The purchase option is only if you want to host it and run it on your own server.
    – scunliffe
    Commented Nov 2, 2010 at 10:18

Your Answer

By clicking “Post Your Answer”, you agree to our terms of service and acknowledge you have read our privacy policy.

Not the answer you're looking for? Browse other questions tagged or ask your own question.