0

What would be a good design for the user to interact with a dataset that has 4 "dimensions", and one of them is editable. It's presented on web, so i have all kind of user interaction in the possibility space.

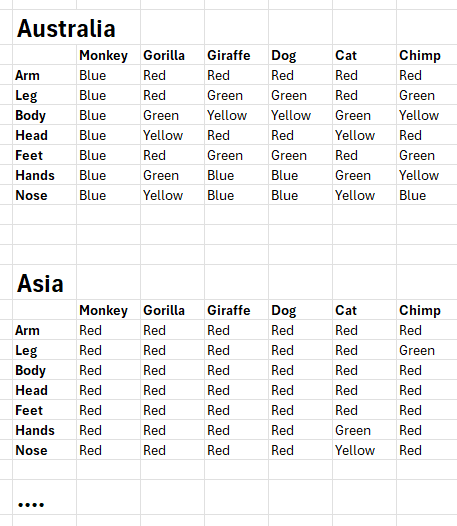
A made up example, in a table:

  • I can put "Type of animal" as columns (dimension 1)
  • I can put "Part of animal" as rows (dimension 2)
  • I can put the color of the animals body part in the actual cell (dimension 3) - a single value will be shown at a time here
  • When i want to add a 4th dimension in here, i get into trouble. Say for example "continent"

Possible solution 1

Replicate the entire table one after another with "continent" as a heading. Takes much space, and all will probably not all be visible at the same time. Tabs instead?

Solution 1

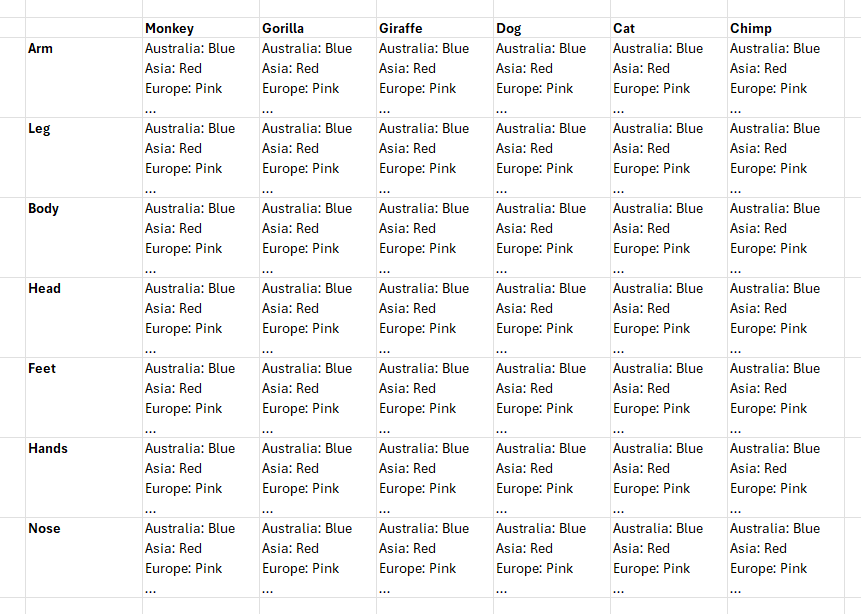
Possible solution 2

Cram all the continents into each cell as a label, followed by the color. The table will be larger but still smaller than previous example. Will be very visually busy. Solution 2
Anyone with experience solving, or has seen this solved in an elegant way?

6
  • Does the user have the possibility to interact, for example by clicking a button, or are the tables static?
    – Danielillo
    Commented Oct 18 at 12:14
  • @Danielillo The color dimension is editable, and can have a single value Commented Oct 18 at 12:16
  • Ok, I guess there's no interaction available, the user can not click a button to change the parent "dimension", because this is the immediate solution
    – Danielillo
    Commented Oct 18 at 12:21
  • Yes, interactions are a possiblity. This is presented on web Commented Oct 18 at 12:25
  • 1
    You should edit the question and add this information as it is essential to understand it and be able to evaluate an answer.
    – Danielillo
    Commented Oct 18 at 12:29

1 Answer 1

1

Interaction greatly reduces the complexity of representing a table with multiple entries. It is as simple as setting interactive parent categories and filtering the table content.

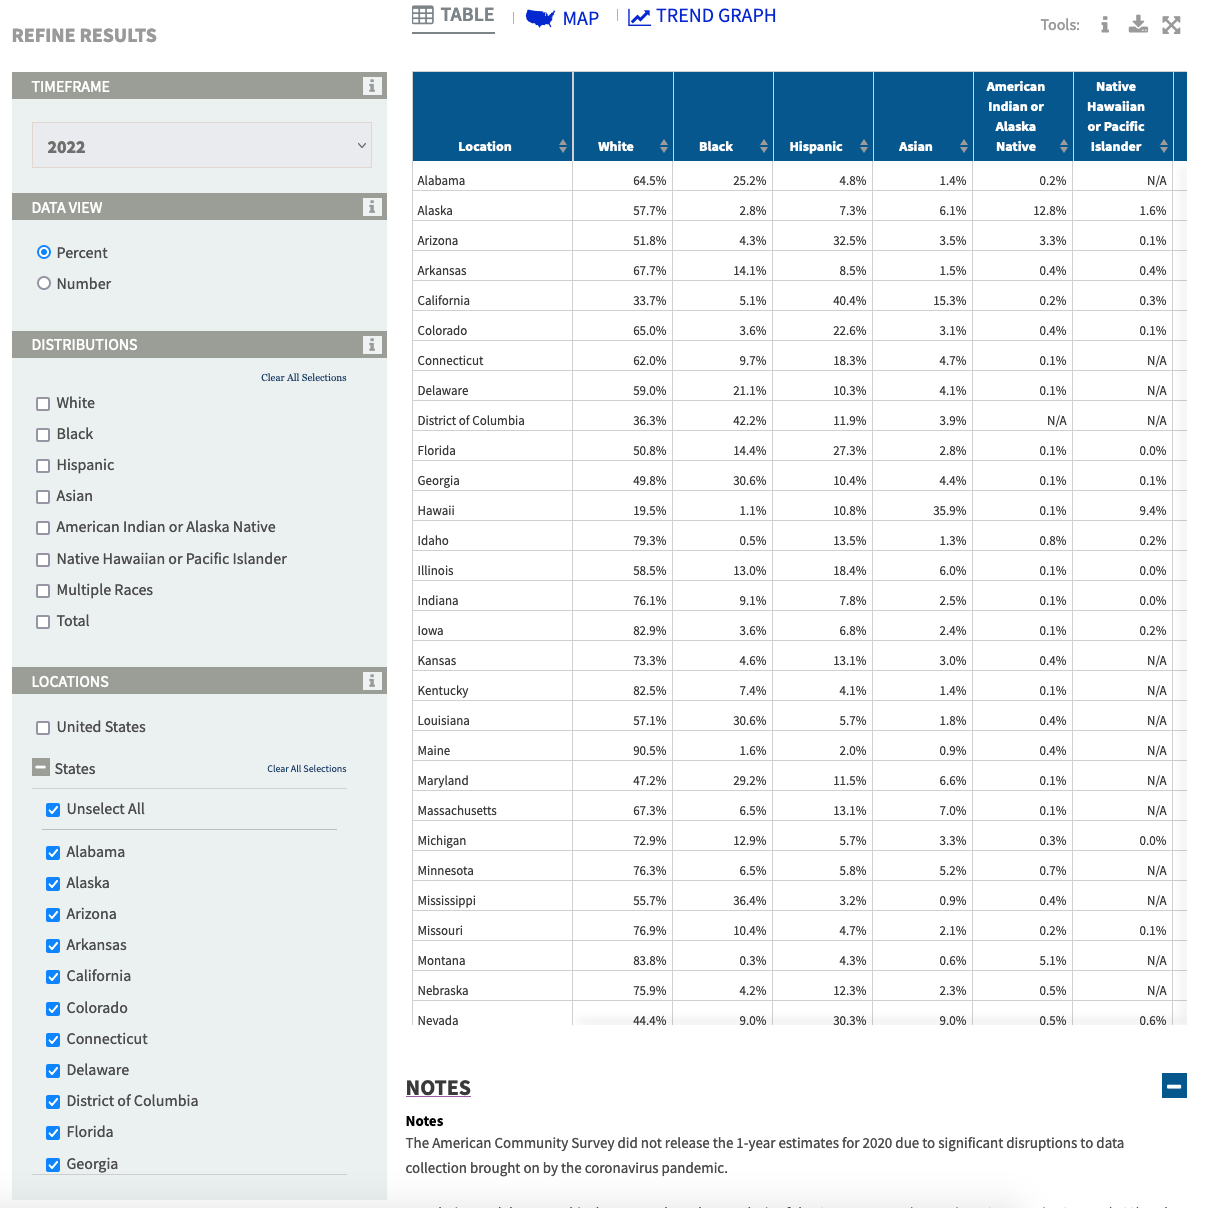
A clear and much more complex example is the Population Distribution by Race/Ethnicity table.

In this case there are:

  • Three modes of representation:

    • Table
    • Map
    • Graph
  • A drop-down menu for each time period

  • Three filters:

    • Data view
    • Distributions
    • Locations
  • A plus: Tools Panel

Population Distribution by Race/Ethnicity

Your Answer

By clicking “Post Your Answer”, you agree to our terms of service and acknowledge you have read our privacy policy.

Not the answer you're looking for? Browse other questions tagged or ask your own question.