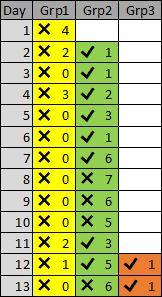
I am afraid that I still have a little bit of trouble understanding the data, so I will go through the process that I used to come up with a concept and hope it will either help you clarify the data or create something that you can use yourself.
- Break down the data into individual components and encode them in some way: there are four pieces of information and they each have a value and a way of encoding the information, so in this instance the day is a number, the problem is a colour, the values are numbers and the direction is a boolean (two opposite or complementary values).
- Group the data into the smallest meaningful unit of information, which in this case is the 4 pieces of information. Any extra units of information will be grouped together and placed alongside the previous group of values.
- Group the data into a bigger block of information, which in this case is the days because you can solve any number of problems in a given day.
- Arrange the data according to their logical order, which in this case is the days because there is a chronological ordering of the information by the days.
If you can be more specific around the use of the data it will help me to understand and refine the initial concept.
An update based on comments and feedback:
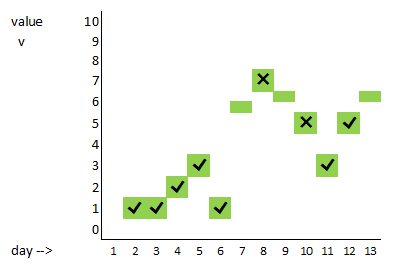
The only way I can see of putting the solved against the not solved is to split a row in half and put one higher and the other way lower like this:


